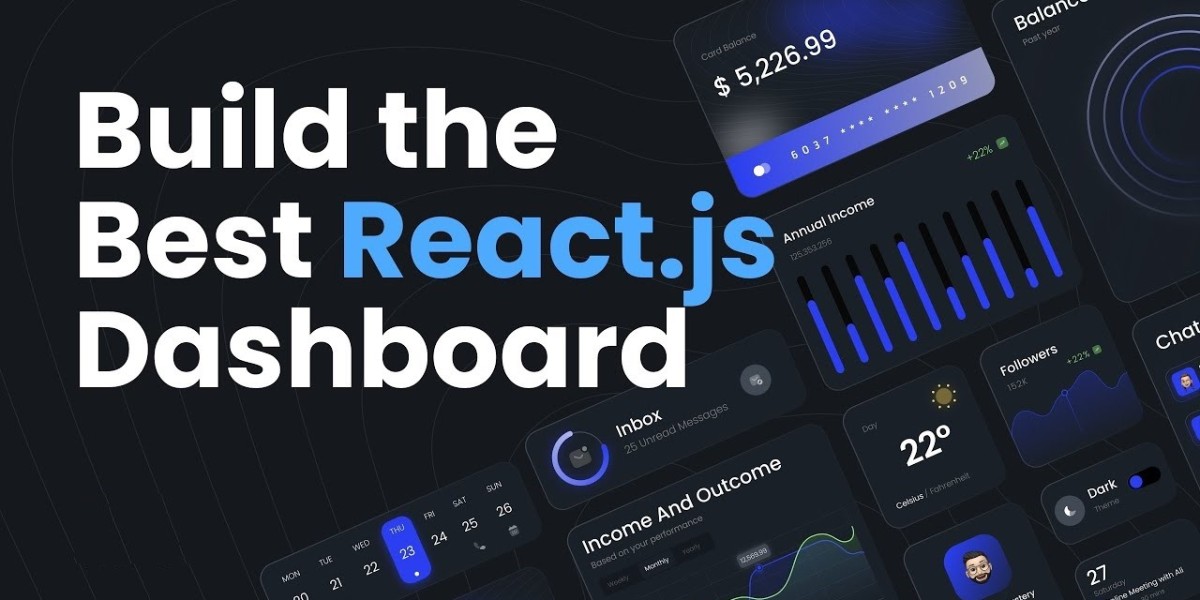
Having a well-crafted dashboard is essential in the modern era of technology, especially for applications with intricate data handling and visualization needs. Whether you are working on a business analytics tool, project management software, or a real-time monitoring system, the effectiveness of your dashboard design can greatly influence user satisfaction and efficiency. Here at NOS Digital, we excel in developing high-quality dashboard interfaces with React JS, ensuring a seamless blend of aesthetics and functionality to elevate user experience and operational efficiency.
Why Dashboard Design Matters
A dashboard serves as the central hub for users to interact with data, track key performance indicators (KPIs), and gain insights into various metrics. An effective dashboard design enhances user engagement by presenting data in a clear, actionable, and aesthetically pleasing manner. The goal is to transform complex data into intuitive visuals that users can easily interpret and act upon.
Why Choose React JS for Dashboard Design?
React JS, developed by Facebook, is a popular JavaScript library for building user interfaces, especially single-page applications where dynamic content is crucial. Here's why React JS is an excellent choice for dashboard design:
Component-Based Architecture: React JS's component-based structure allows for reusable UI elements. This modular approach makes it easier to manage complex dashboards by breaking them down into smaller, manageable components.
Performance Optimization: React's virtual DOM efficiently updates and renders only the parts of the interface that have changed. This leads to faster performance and a smoother user experience, which is essential for interactive dashboards that handle large datasets.
Rich Ecosystem: React JS has a vast ecosystem of libraries and tools that can enhance dashboard functionality. Libraries like Redux for state management, D3.js for data visualization, and React Router for navigation can be seamlessly integrated.
Scalability: As your application grows, React JS provides the flexibility to scale your dashboard without significant refactoring. This is crucial for long-term projects that need to adapt to evolving user needs and data requirements.
Key Features of a Great Dashboard Design
To build an effective dashboard using React JS, certain features and design principles should be prioritized:
User-Centric Design: A dashboard should be designed with the end-user in mind. This involves understanding their needs, preferences, and the specific tasks they need to accomplish. NOS Digital UAE emphasizes user research and testing to ensure the dashboard meets these requirements.
Data Visualization: Effective data visualization is crucial for making complex data understandable. This includes using charts, graphs, tables, and other visual elements to represent data clearly. React JS integrates well with visualization libraries like Chart.js and Recharts to provide dynamic and interactive visualizations.
Real-Time Updates: Many dashboards require real-time data updates to provide accurate and timely information. React JS's efficient data handling capabilities, combined with WebSocket integration, ensure that your dashboard remains up-to-date with live data.
Customizability: Users should be able to customize their dashboards to suit their specific needs. This could include filtering data, rearranging widgets, or choosing different visualization types. React JS allows for flexible and customizable UI components that can be tailored to individual user preferences.
Responsiveness: In the mobile-first world, ensuring that your dashboard is responsive and works well on various devices is essential. React JS supports responsive design principles, making it easier to create dashboards that adapt to different screen sizes and resolutions.
Performance: A dashboard should load quickly and respond promptly to user interactions. React's performance optimization features, such as lazy loading and code splitting, help achieve this goal.
NOS Digital UAE's Approach to React JS Dashboard Design
At NOS Digital UAE, we are committed to delivering exceptional dashboard designs that leverage the power of React JS. Our approach involves several key steps:
1. Understanding Client Needs
We begin by conducting thorough consultations with our clients to understand their specific needs and goals. This includes identifying key metrics, user personas, and desired functionalities. This initial phase ensures that we build a dashboard that aligns with the client's business objectives.
2. Design and Prototyping
Our design team creates wireframes and prototypes to visualize the dashboard layout and functionality. We focus on creating intuitive and user-friendly designs that enhance the overall user experience. Client feedback is incorporated into the design process to ensure that the final product meets expectations.
3. Development with React JS
Using React JS, our developers build the dashboard with a focus on performance, scalability, and maintainability. We leverage React's component-based architecture to create reusable and modular UI elements. Our team also integrates advanced data visualization tools to present information in a meaningful way.
4. Testing and Quality Assurance
Before the dashboard goes live, we conduct extensive testing to identify and resolve any issues. This includes functional testing, performance testing, and usability testing. We ensure that the dashboard performs optimally across different devices and browsers.
5. Deployment and Support
Once the dashboard is ready, we handle the deployment process and provide ongoing support to address any post-launch issues or updates. Our team is available to make any necessary adjustments and ensure that the dashboard continues to meet the client's evolving needs.
Case Studies: Successful Dashboard Projects
To illustrate our expertise, here are a few examples of successful dashboard projects completed by NOS Digital UAE:
1. Financial Analytics Dashboard
We developed a comprehensive financial analytics dashboard for a leading investment firm. The dashboard features real-time stock market data, performance charts, and portfolio tracking. Using React JS, we created an interactive and responsive design that allows users to monitor their investments effectively.
2. Project Management Dashboard
For a large project management company, we designed a dashboard that provides a centralized view of project progress, team performance, and task management. The dashboard includes interactive Gantt charts, task filters, and team collaboration tools, all built using React JS to ensure a seamless user experience.
3. Healthcare Monitoring Dashboard
We created a healthcare monitoring dashboard for a medical research organization. The dashboard displays patient data, medical trends, and research statistics. With React JS, we incorporated real-time data updates and advanced visualization techniques to support data-driven decision-making in the healthcare sector.
Conclusion
A well-designed dashboard is a powerful tool that can enhance user experience, streamline data management, and drive informed decision-making. By choosing React JS for your dashboard design, you benefit from its performance optimization, component-based architecture, and rich ecosystem of libraries. NOS Digital UAE brings expertise in creating exceptional dashboards that leverage these advantages to deliver top-notch UI/UX solutions.
If you're looking to elevate your application's user experience with the best dashboard design in React JS, contact NOS Digital UAE today. Our team of experts is ready to help you create a dashboard that meets your needs and exceeds your expectations.


